All posts
AI Engineering·6 min read·Updated 18 Sept 2026

Chrome DevTools MCP: Let Your AI Agent Debug the Browser (2026 Guide)

Quick answer
Chrome DevTools MCP is Google's MCP server that lets a coding agent drive a real Chrome: record performance traces, inspect network requests, read the console and take screenshots. Add it to Claude Code with claude mcp add chrome-devtools -- npx -y chrome-devtools-mcp@latest. Usage statistics are on by default; add --no-usage-statistics to opt out.

Google's Chrome DevTools MCP server lets Claude Code, Codex and Cursor read performance traces, network requests and the console. Setup, flags, and the privacy defaults to change.

Piyush Jangir
Verified author

Founder of StackPicks. Self-taught builder shipping open-source dev tools, marketing, and curator content since 2019. Based in Mumbai, India. Available on GitHub and LinkedIn.

6 min read
Chrome DevTools MCP: Let Your AI Agent Debug the Browser (2026 Guide)

**Short version:** Chrome DevTools MCP, from Google's Chrome DevTools team, lets a coding agent open a real Chrome and look at the same panels you would: performance, network and console. It is the fix for agents that change a page and then guess why it broke. It has about 52,000 GitHub stars, and version 1.9.0 shipped on 8 September 2026. Details below are from the project README.
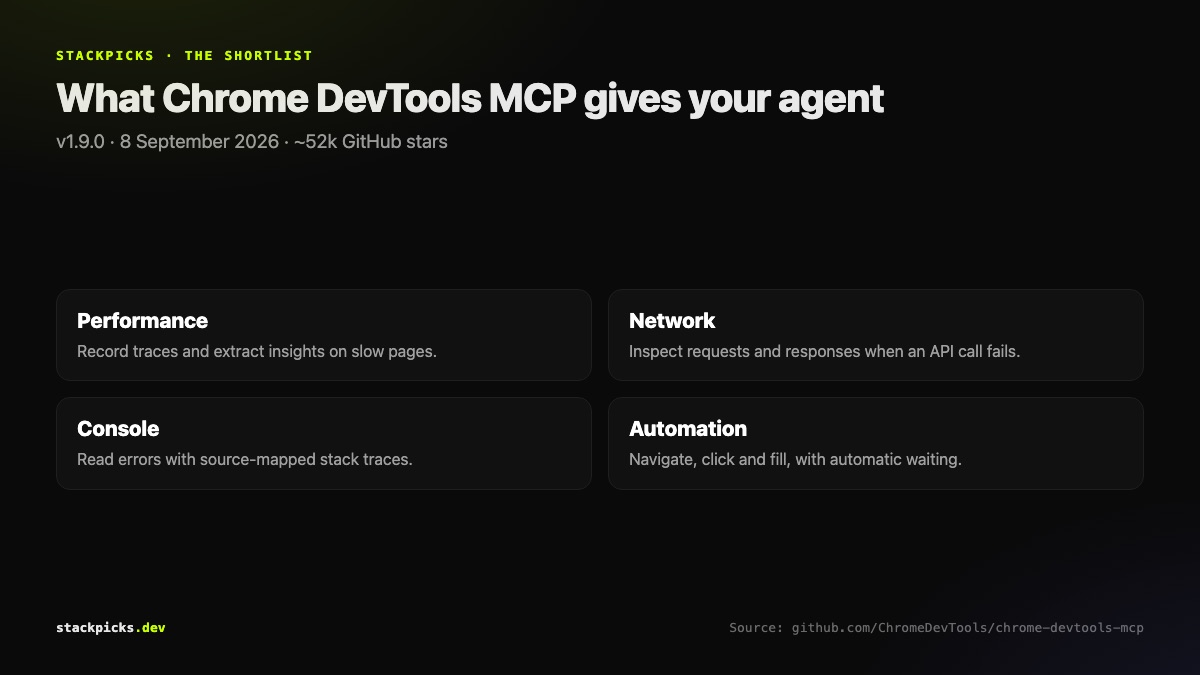
What Chrome DevTools MCP lets a coding agent do

Install it

Claude Code:

claude mcp add chrome-devtools -- npx -y chrome-devtools-mcp@latest --no-usage-statistics

Other clients: use command npx with args ["-y", "chrome-devtools-mcp@latest"]. You need a current Node.js LTS release and stable Chrome.

What it can do

  • Performance: record a trace and pull out insights, so "the page feels slow" becomes a specific long task.
  • Network: inspect requests and responses when an API call fails.
  • Console: read errors with source-mapped stack traces.
  • Automation: navigate, click and fill, with automatic waiting for results.

The flags worth knowing
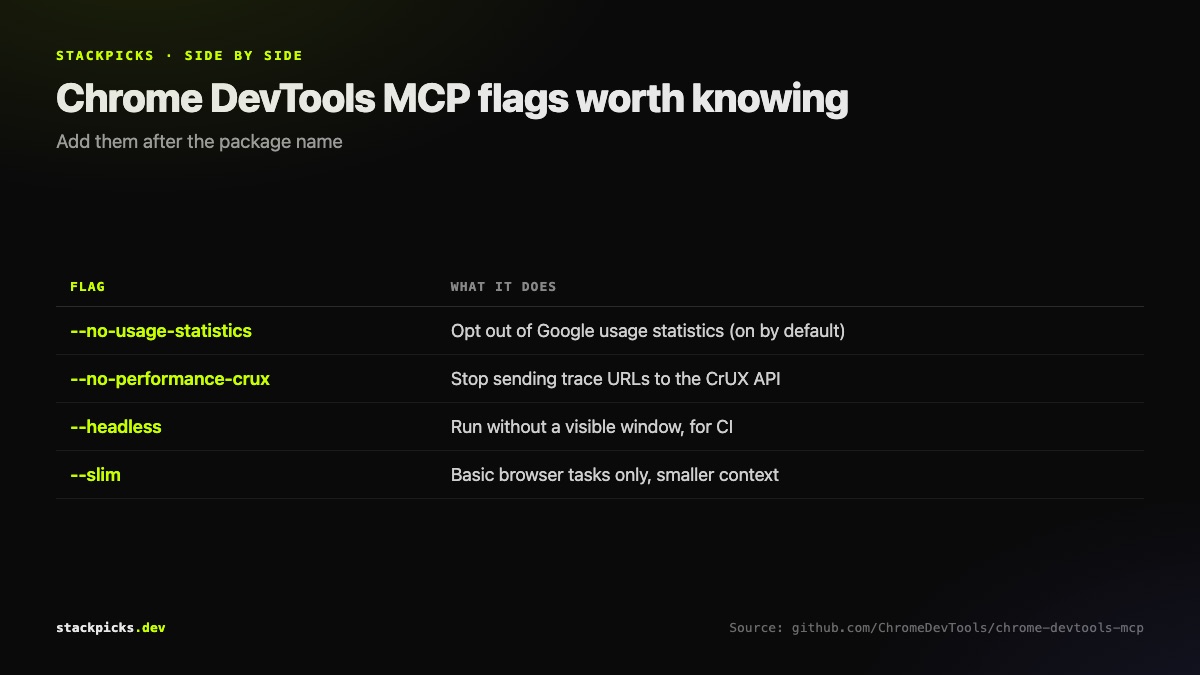
Chrome DevTools MCP configuration flags

  1. Privacy:

- --no-usage-statistics turns off Google's usage statistics, which are on by default.

- --no-performance-crux stops trace URLs going to the Chrome UX Report API.

  1. Environment:

- --headless for CI and remote machines.

  1. Context size:

- --slim exposes basic browser tasks only, which keeps tool definitions small.

Use a separate browser profile

The server exposes the browser's content to your AI client, which can inspect and modify any data in it. Never point it at a profile that is signed in to your bank, email or production admin tools. A throwaway profile or headless mode is the right default.

A workflow that shows its value

Ask the agent to fix a layout bug, then to open the page, read the console and confirm the fix before telling you it is done. That closes the loop that most agent-written frontend code leaves open. Pair it with the Playwright server from our best MCP servers list when you also need to reproduce multi-step flows.

Frequently asked questions

What can Chrome DevTools MCP do that Playwright MCP cannot?+

Playwright's server is built for automating and testing user flows. Chrome DevTools MCP is built for debugging: it records performance traces and extracts insights, inspects network requests, and reads console messages with source-mapped stack traces. Many developers connect both, using Playwright to reproduce a flow and DevTools to understand why it is slow or broken.

Does Chrome DevTools MCP collect data?+

Yes, by default. The README states Google collects usage statistics such as tool success rates, latency and environment information. Opt out with the --no-usage-statistics flag, or set CHROME_DEVTOOLS_MCP_NO_USAGE_STATISTICS; it is also disabled when the CI variable is set. Performance tools additionally send trace URLs to the Chrome UX Report API unless you pass --no-performance-crux.

Is it safe to point Chrome DevTools MCP at my logged-in browser?+

Be careful. The server exposes the content of the browser instance to the MCP client, which can inspect, debug and modify any data in it. Do not use it with a browser profile that is logged into your bank, email or production admin panels. Use a separate profile, or headless mode, for anything an agent drives.

What do I need to run Chrome DevTools MCP?+

A current Node.js LTS release, npm, and the current stable version of Google Chrome or newer. Official support covers Google Chrome and Chrome for Testing; other Chromium-based browsers may behave unexpectedly. The server runs locally through npx, so there is no account or API key to set up.

How do I run Chrome DevTools MCP headless?+

Add the --headless flag after the package name, for example npx -y chrome-devtools-mcp@latest --headless. That suits CI and remote machines. The --slim flag limits the server to basic browser tasks, which also reduces the tool definitions loaded into your agent's context, useful if you only need navigation and screenshots rather than full performance analysis.

More in AI Engineering

Chrome DevTools MCP: Let Your AI Agent Debug the Browser (2026 Guide) — StackPicks — StackPicks